Tibor bá’ szerkesztett fordítása, amit E-mailben elküld a VIP előfizetőknek
When is a Blue Ocean Event Going to Happen? Some Volumetric Predictions

For those who aren’t paying attention, one of the most catastrophic consequences of climate change is the impending “blue ocean event” or “BOE” (with thanks to Paul Beckwith for this terminology). A BOE is defined to be when the Arctic Ocean is covered by less than 1 million square kilometers of ice (the “extent” of the ice is < 1M square km). There are many different media posts about the consequences of a BOE. If you want some basic information, I recommend the YouTube video “Blue Ocean Event. Game Over?” in the “Just Have a Think” channel.
There are three different measurements that are used for consideration of the loss of Arctic sea ice. The first and most commonly used measurement is “extent.” (all definitions from Wikipedia), defined as follows:
“Sea ice extent is the area of sea with a specified amount of ice, usually 15%. To satellite microwave sensors, surface melt appears to be open water rather than water on top of sea ice. So, while reliable for measuring area most of the year, the microwave sensors are prone to underestimating the actual ice concentration and area when the surface is melting.”
Next, the “area” of Arctic sea ice is computed by looking at areas of the Arctic that actually have ice. This is not considered as reliable as extent because determining what is ice on a pixel is, um, challenging.
To estimate ice area, scientists calculate the percentage of sea ice in each pixel, multiply by the pixel area, and total the amounts. To estimate ice extent, scientists set a threshold percentage, and count every pixel meeting or exceeding that threshold (15%) as “ice-covered.”
Finally, the measurement that I find most significant, but the hardest and most unreliable to compute, is the total volume of Arctic ice.
“There are no Arctic-wide or Antarctic-wide measurements of the volume of sea ice, but the volume of the Arctic sea ice is calculated using the Pan-Arctic Ice Ocean Modeling and Assimilation System (PIOMAS) developed at the University of Washington Applied Physics Laboratory/Polar Science Center. PIOMAS blends satellite-observed sea ice concentrations into model calculations to estimate sea ice thickness and volume. Comparison with submarine, mooring, and satellite observations help increase the confidence of the model results.”
Most of the great graphics, charts & predictions for a BOE are based on Arctic ice extent. I made such a chart recently and posted it to Twitter. My prediction, based on the trendline, was a BOE before the year 2060.
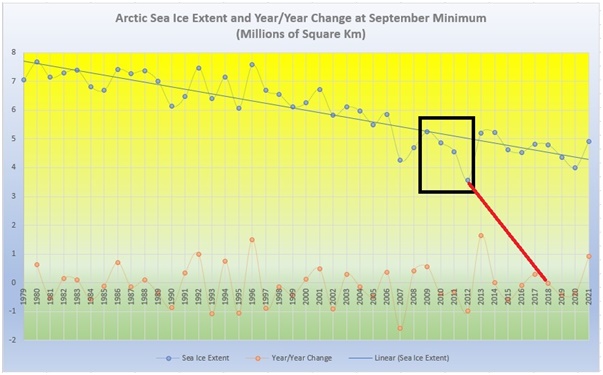
I also noted that those who were predicting an ice-free Arctic by 2020 had good short-term evidence. If you look at the graph starting at 2009 and ending in 2012, you see what looks like an exponential decrease in extent. The trendline for those four years is shown in red.
I was trolled in that Twitter post for not using all the data (I just considered the annual minimum, not all ice extent numbers). There is at least one celebrity YouTuber who likes to make predictions for when a BOE will happen — typically he says in the next 3 years or less. People who follow typically also believe in so-called near-term human extinction (NTHE). I am on the fence about this idea, so I tend to consider these views to be outliers but not necessarily untrue. However, that troll inspired me to look at making a BOE prediction in a different way. In this post, I am going to share a few predictions for an ice-free Arctic based on the less reliable but more compelling volume data.
First, the following chart gives the Arctic Minimum Sea Ice Volume (in 1000 cubic kilometer units). I’ve also include a linear trendline. This minimum occurs in mid-September each year.
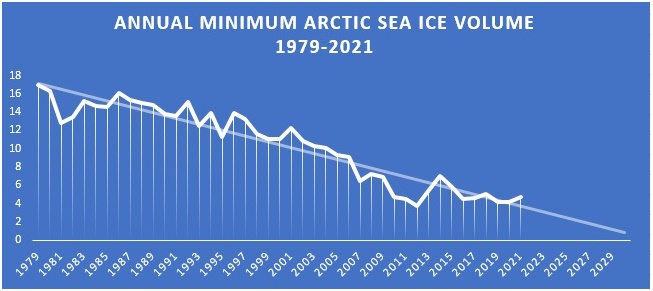
This chart seems to indicate an ice-free Arctic by 2030. But short term trends tell a different story. For example, the last 10 years has been nearly flat. So, has the volume stabilized or are we going to run out of ice by 2030? Hard to tell for sure, but this chart scores one point for a BOE happening by 2030.
Next, we will look at the Arctic Average Sea Ice Volume (again in 1000 cubic kilometer units). This average is over the entire year. This chart gives a sense for how fast the Arctic is losing its ice, but does not necessarily make a good BOE predictive tool.
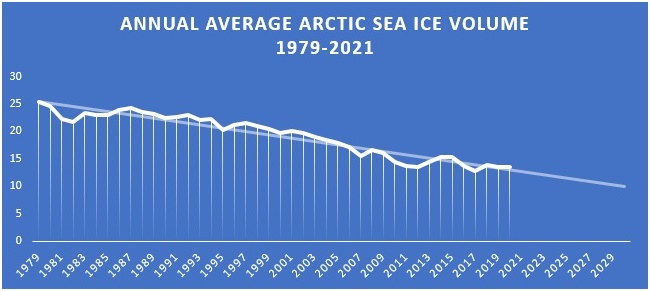
The average amount of Arctic ice is steadily dropping, well, that is up to 2013 again. Average ice volume has been relatively stable since then, although a new “minimum average” was hit in 2017 (12,890 km^3). When the average amount of ice hits zero, that must correspond with a fully year-around ice-free Arctic. Extending this trendline way out there, that year is about 2070. So — one point for an ice-free Arctic by 2070 (which corresponds to a BOE 10 years earlier, in 2060). That said, if a BOE event occurs by 2030, the impact will be non-linear and a completely ice-free Arctic should occur within about a decade.
Now, what about maximum ice volume? This maximum volume usually occurs in April. Here is the chart.
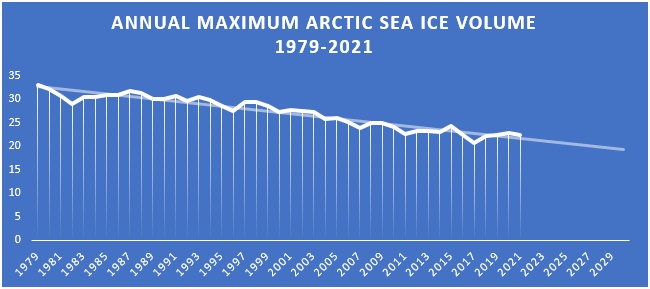
What this chart indicates if you extrapolate out the trendline is that there should be some measurable quantity of ice remaining year-around in the Arctic through 2100. I also note that the “minimum maximum” happened in 2017 (20,664 km^3). But again, a BOE by 2030 will completely change this chart. A BOE will bring a catastrophic increase in ocean heating. This, in turn, will create a sharp downward break in maximum volume.
Finally, what I consider to be the most telling way to make a prediction for a BOE — the percentage of existing ice that is melting each year. We are simply asking for the percentage of ice that was there at the April maximum that has melted by the September minimum. If 100% melts, that’s beyond a BOE — it means no ice at all in the Arctic, not just less than 1 million square kilometers. For that reason, I will conservatively estimate that when the melt percent gets beyond 95%, a BOE will occur.
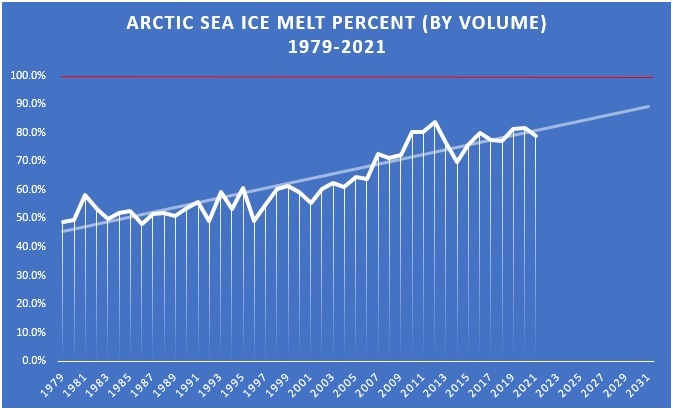
This chart puts the trendline above 95% by about the year 2040. So, score one point for a BOE by 2040.
Looking more closely at this chart, it shows that the Arctic melt rate of the previous decade flattened out during the period 2012-2021. But, GHG emissions continued to grow over this decade, arctic amplification accelerated, corporate-industrial civilization boomed and global temperatures continued to rise. It is just a matter of time before the melt gets back on track.
Final score: 1 point for 2030, 1 point for 2040, 1 point for 2060, with a completely ice-free Arctic happening within 10 years after the initial BOE. Averaging things together, the year 2043 is my volumetric BOE over/under.
Look — things are bad. They are really bad. I am not sure what climate catastrophe in particular is going to be the big one, but it doesn’t matter. There is no prize for predicting the first BOE or for having the AMOC be the big one, or whatever. What matters is the suffering along the way.
Please do everything you can to be kind, be generous as much as you are able and be of service.
_________________________________________________________________________________________________________________________________________________________________________________________________________________________________
Gratulálok Tibor bá!
Mi történt veled, hogy egy ilyen kiegyensúlyozott cikket/véleményt közölsz? Ebben a témában nem volt szokásod… Általában azon „kutatók” véleményét ismertetted, akik az első grafikonon meghúzták a piros trendvonalat.
Ezek után van még remény, hogy a harmadik K-betűs témában is, amelyben túlteng a kamu kutatók véleménye egyre tisztábban láss ( Koleszterin, Klíma, Korona) és megtaláld a középutat a Kúrva-média által sulykolt és a Konteósok által közölt vélemények között.
1 – M.Szilárd:
Öregebb lettem
😀
A több verziót nézve egy átlagember hamar bele tud keveredni ezekbe a forgatókönyvekbe. A cikk kicsit olyan mint amikor nagy marketingel el akarnak nekük adni valamit és az eladó próbál minket nagy marketingszöveggel összekeverni hogy beleugorjunk a vételbe.Talán azért nincs hozzászólás sem mert jelenleg érdemben nem tudunk következtetni hogy mikor lesz gebasz 5 év 10 év. stb…..
Még a tudósok sem tudják nemhogy egy átlagember kihámozza a lényeget.Persze a baj lehet máshonan üt be.
A termény jelentősen drágult amiben benne van a covid, Kína és a klíma is.Most úgy néz ki nagyobb baj lesz a termékek áremelkedése a covid miatt a következő években mint a klíma miatti terméskiesés.
A covid miatt a hiányok megmaradnak ezáltal az árak emelkednek.Kíváncsi leszek hogy a műtrágyahiány hogy csapódik le jövőre az élelmiszerárakon. Ez fokozódhat még ha globálisan vagy akár csak Kínában
szélsőséges lesz az időjárás és Kína tovább folytatja a terményfelvásárlást és az árak tovább ugorhatnak felfelé és jövőre még nagyobb mértékben ha kitör egy kis hiszti.Mert az árakat majd nem csak a hiány nyomja fel
hanem a mögötte lévő hiszti és a tőzsdén ez pluszban rádob majd az árakra, így szembesülhetünk 1-300%-os emelkedéssel majd itt is.(feltételes módban).Nyilván már ez is egy összeomlás amikor pl. az élelmiszerár majd mondjuk felmegy 1-300%-ot , a fizetések meg maradnak ott ahol vannak. Tulajdonképpen egy külön poszt lehetne hogy mit jelent az emikor az árak elszállnak 1-300%-ot de a fizetőképes kereslet nem követi ezt.
Az összeomlásnak már ez is egy fajtája.Ráadásul ez már nem a z 1940-80-as évek összeomlása amikor 1-2 év múlva újra helyreállt minden mert olcsó volt az energia vagy az élelem és újra helyre lehetett pofozni mindent.
Érdemes nézegetni a terményárak változását: https://www.agroinform.hu/termenypiac
3 – Andrew:
A posztnak nem ez a témája. De te egy Móricka vagy, akinek mindenről ez jut az eszébe.
Khm. 3.
A fizetőképes keresletet fent kell tartani. Ha a vásárlónak nincs pénze, illetve igénye sem akkor van vége mindennek.
A gebasz már régóta van, maximum a fizetőképes kereslet spekulatív fent tartásával elódázzuk a gondokat, ki tudja, hetekre, hónapokra, évekre.
Viszont van egy kimerülési határérték…
Illetve egy bizonyos rizikófaktor, az előre nem látható események kapcsán.